|
|
|
|
|
|

|
|
|
|

|
|
_
|
|


The Monthly Consumer Survey from BIGinsight™ monitors over 8,000 consumers each month providing unique insights & identifying opportunities in a fragmented and transitory marketplace.
Talking Points:
- Economic sentiment perked up from June, though consumers failed to set off any fireworks compared to years past
- Workers show signs of concern for personal job security
- With the campaign season about to hit full throttle, consumers seem to be bracing for the onslaught of political propaganda
- The uptick in consumer confidence this month may be leading a few shoppers off the practicality platform
- July pump price prediction: $3.49/gal
- Holiday ’12 Preview
- Was JC Penney’s Fair & Square strategy a gift to Macy’s in Women’s Clothing?
- Consumer Buzz: Shoes
- 90 Day Outlook: Back-to-School (i.e. Children’s Clothing) looks to be a bright spot in consumers’ spending plans
- What’s Hot? Farmers’ fresh fare beats out Spider-Man, Dark Knight
|
|
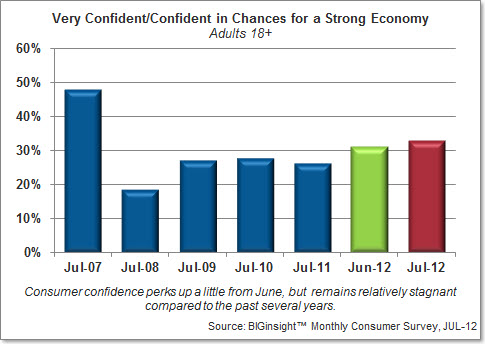
While economic sentiment perked up from June, consumers failed to set off any fireworks compared to years past…this month, 32.8% say they are very confident/confident in chances for a strong economy, up more than a point from June (31.3%). While sentiment remains elevated from Jul-11 (26.5%), this month’s reading looks a little stagnant when placed in a longer-term perspective – and well below Jul-07’s pre-recession figure of 47.8%.
Speaking of stagnant – how about that 8.2% U.S. unemployment rate? Despite June’s discouraging news from the BLS, consumers are perhaps thinking bullishly ahead to the holiday hiring season…fewer (25.9%) foresee “more” layoffs over the next six months compared to June (27.0%) as well as Jul-11 (29.6%). The majority of consumers continue to predict more of the “same” (55.4%), while the minority (18.7%) is hopeful for “fewer” pink slips.
While the outlook for employment seemed to brighten over the past month, workers are still showing concern…in July, 4.2% admitted they were anxious about becoming laid off, up half a point from last month (3.7%) as well as last year (3.6%).
With the campaign season about to hit full throttle, consumers appear to be bracing for the onslaught of political propaganda…in July, nearly one out of five (19.7%) reported that they worry more about political and national security issues, level with last month’s 19.5% and up a point from Jul-11 (18.7%). Overall, consumers seem a little less apprehensive this Presidential go-around than they did during the 2008 McCain vs. Obama election (Jul-08 = 24.4%).
While the Obama vs. Romney race for the White House is sure to make history in 2012, what can you recall about our past Presidents? In one of our new blog posts, we pop-quizzed consumers about our Founding Fathers and graded their answers by generation in Generation Gap: Presidential Pop Quiz.
|
|
It appears that the uptick in consumer confidence may be leading a few shoppers off the practicality platform…this month, 47.8% say they’ve become more pragmatic in their purchasing, off slightly from a month ago (48.2%) and down two points from Jul-11 (49.9%). Before you start thinking “spending rebound,” though, keep this in mind: practicality remains well above the sensible shopping tendencies we witnessed before the Great Recession (Jul-07 = 38.8%).
Here’s another reason why shoppers aren’t likely to spend in droves this summer…focus on needs over wants is on the rise. This month, 56.1% indicate that they are focused on just the necessities when at the store, rising more than a point from June (54.7%), though remaining just under last year’s figure (58.5%).
Perhaps prepping for the Q4 holiday spending season [more on that in a minute] or simply uncertain about our economic future, consumers seem focused on finding stronger financial footing this month…over a third (36.1%) plans to decrease overall spending over the next three months, up more than three points from last month and the highest July reading we’ve recorded since recession-era Jul-08 (39.2%). Nearly as many (34.5%) indicate plans to pay down debt, also on the rise from June (32.6%), while an increasing number plans to increase savings (28.3%) and pay with cash more often (23.0%) compared to last month.
With the brake seemingly set on the so-called summer gas price hike, an increasing number of drivers (28.5%) say that pump prices are having “no major impact” on their budgets compared to a year ago (23.4%). But let’s face it – that’s still seven out of ten consumers (71.5%) who say that the cost of fueling up is still putting a dent in their wallets. Among these more cash-strapped shoppers, two in five (41.0%) are simply driving less to defray fuel-related expenditures. Others are reducing dining out (36.1%), decreasing vacation/travel (35.0%), and spending less on clothing (29.8%).
This may help inspire a little more spending confidence in coming months…fewer (30.0%) are anticipating a pump price hike by the end of the month, compared to those with the same expectations for the close of June (38.1%). Nearly half (44.6%) expect the cost of fueling up to remain relatively stable, while a quarter (25.5%) is optimistic for an overall decline. Drivers are predicting an average pump price of $3.49/gal by July 31, 25 cents below their forecast for the end of June ($3.75/gal).
For more on this high-octane topic, head over to the BIG Consumer Blog for our latest post: Pain at the Pump: Who (or What) is Controlling Pump Prices?
|
|
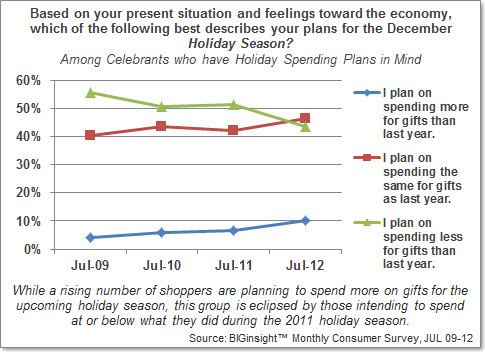
Are you one of the few millions who feels that it’s too early to be talking Back-to-School? Let’s change the subject and take a look at the upcoming holiday shopping season instead. Since July 2009, we’ve been asking shoppers about their gift giving plans, specifically if they think they will be spending more, the same, or less than they did in the previous year. While a fairly large proportion (28.1%) says it’s too early to tell, among those with a budget already in mind, we found that a bit of Christmas cheer might be in store for retailers: one in ten (10.2%) says they plan to spend more on gifts this year, up from 6.5% in Jul-11. Keep in mind, though, that the vast majority is anticipating spending the same (46.3%) or less (43.4%) compared to last year, so it doesn’t appear that Santa will have to build a bigger sleigh quite yet.
For more on the 2012 Holiday Shopping season, including spending plans by generation as well as how those spending less are planning to cut back, visit the BIG Consumer Blog.
Was JC Penney’s Fair & Square strategy a gift to Macy’s? For the sixth consecutive month, Macy’s bests JC Penney in Women’s Clothing, with 7.4% shopping there most often to the EDLP department store’s 6.6%. Both retailers trail Kohl’s (11.9%) and Walmart (11.7%), while Target (2.8%) completes the Top 5.
Over in the Men’s section, Walmart maintains its lead with 15.9% shopping there most often…Kohl’s (11.6%), JC Penney (8.8%), Macy’s (6.0%), and Target (3.2%) round out the Top 5.
In the well-documented Shoe Wars, one retailer is M.I.A. in July…Walmart (10.6%) and Payless (10.2%) continue to lead this group, while Kohl’s (6.3%), DSW (3.9%), and Foot Locker (3.7%) follow. Yes, that’s right (and you heard it here first)…JC Penney (now #6) has been bounced from the Top 5 by Foot Locker.
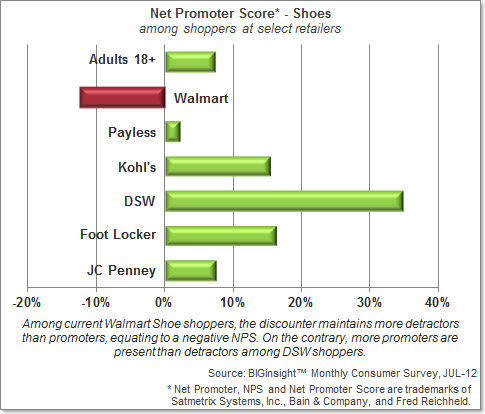
While JC Penney’s strategy flip-flop doesn’t appear to have done them any favors, was the department store a victim of bad buzz in the Shoe department? We’ve applied the Net Promoter Score metrics system to our latest footwear data to show how consumers perceive their store of choice and evaluate the strength of a retailer’s image in this category. Perhaps surprisingly, JC Penney maintains a positive NPS – albeit a little lackluster with its on-average score. Walmart maintains a negative NPS among its Shoe shoppers, which is consistent with our findings in Women’s Clothing. Kohl’s, DSW, and Foot Locker calculate relatively stellar Net Promoter Scores – here’s the challenge for these retailers: how do you take positive customer buzz and turn it into share growth?
Net Promoter, NPS and Net Promoter Score are trademarks of Satmetrix Systems, Inc., Bain & Company, and Fred Reichheld
Despite its “showroom” label, Best Buy still seems to be buzzing among Electronics shoppers…the big box is a best bet among more than a third of shoppers (34.8%), while more than one in five (22.4%) head to Walmart most often. Amazon.com (8.3%), Target (3.6%), Sears (1.6%), and Fry’s (also 1.6%) follow.
With the majority of shoppers headed to Home Depot (32.6%) or Lowe’s (27.9%) most often, these retailers continue to hammer the competition for Home Improvement/Hardware, with Walmart (6.9%), Menards (4.2%), and ACE Hardware (3.2%) following in the single digits.
Dick’s benches Walmart in Sporting Goods…with 16.3% shopping there most often, the big box outscores the big W (15.6%) – and typical #1 – for July. Sports Authority (5.0%), Academy (3.7%), and Big 5 (3.6%) are relative minor leaguers.
With its national presence, Walmart brings it’s “A” game in Groceries…more than one-fifth (21.2%) shops the discounter most often in this category, followed by traditional retailers Kroger (7.0%), Publix (4.2%), Shoprite (2.9%), and Safeway (2.8%).
The big W also proves it’s no powder puff in Health & Beauty Care…nearly a third (31.4%) heads to Walmart most often for soaps, shampoos, and such, while CVS (12.4%) and Walgreens (10.4%) follow. Target (7.2%) and Rite Aid (4.1%) complete the Top 5.
It’s the druggists with the top spots in Prescriptions, though…CVS (19.4%) and Walgreens (17.4%) continue to lead this category, followed by Walmart (12.4%), Rite Aid (6.2%), and Target (3.0%).
|
|
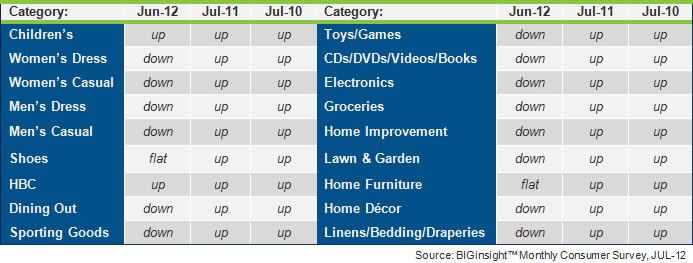
Back-to-School (i.e. Children’s Clothing) looks to be a bright spot in consumers’ spending plans over the next 90 days, according to the BIGinsight™ Diffusion Index. With the majority of categories facing DOWNward compared to June, revenues may fizzle instead of sizzle as we make our way through summer:
Retail Merchandise Categories - 90 Day Outlook
(Jul-12 compared to Jun-12, Jul-11, and Jul-10)
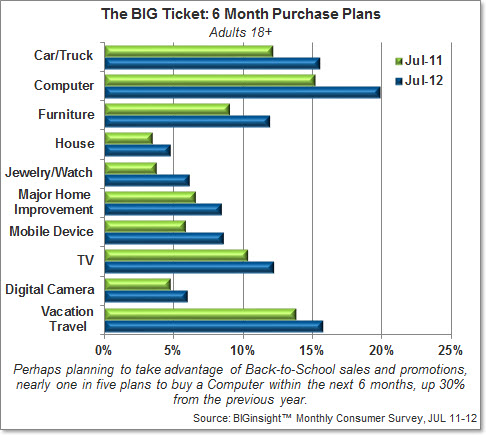
We may see an interesting Holiday ’12 after all, as six month purchase intentions remain fairly aggressive for BIG Ticket items…all categories, including Autos, Computers, Jewelry, Mobile Devices, and Vacation Travel are on rise this month compared to one year ago:
For more on summer vacation plans, check out the BIG Consumer Blog: Will 2012 Mark the Return of the Great American Vacation?
|
|
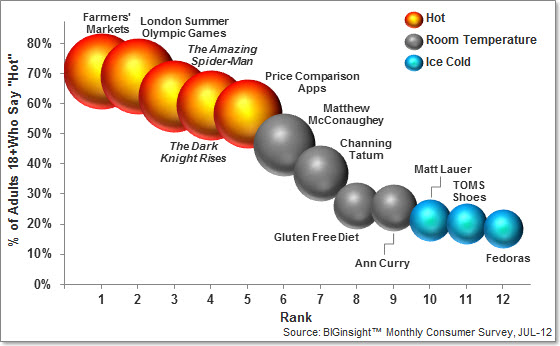
While it appears that The Amazing Spider-Man and The Dark Knight Rises will make this a blockbuster summer, these movies don’t seem to hold a candle torch to the London Summer Olympic Games or…Farmers’ Markets. Yes, fresh fruits and veggies top our list of What’s Hot in July. While the superhero features will drive young men into theaters this month, women have different motivations: Magic Mike’s Channing Tatum (among females 18-34) and Matthew McConaughey (for ladies 35+). What’s not? Matt Lauer’s Q Score seems to have suffered in the wake of the controversial re-casting of Ann Curry on the Today show. [Who knew AM TV packed so much drama?]

Editor
BIGinsight™ is a trademark of Prosper Business Development.
400 West Wilson Bridge, Suite 200, Worthington, Ohio 43085
614-846-0146 • FAX 614-846-0156 • info@BIGinsight.com
follow us...
![]()
We welcome and appreciate the forwarding of our Executive Briefings in their entirety or in part with proper attribution.
© 2012, Prosper®